Context Graph: Visualize LIA Intelligence
Threat intelligence has always been about connecting dots. Now you can actually see them in an interactive relationship map built from tasks, payload, detections and infrastructure data. Today we’re shipping the Context Graph — an interactive relationship visualization layer directly in LIA.
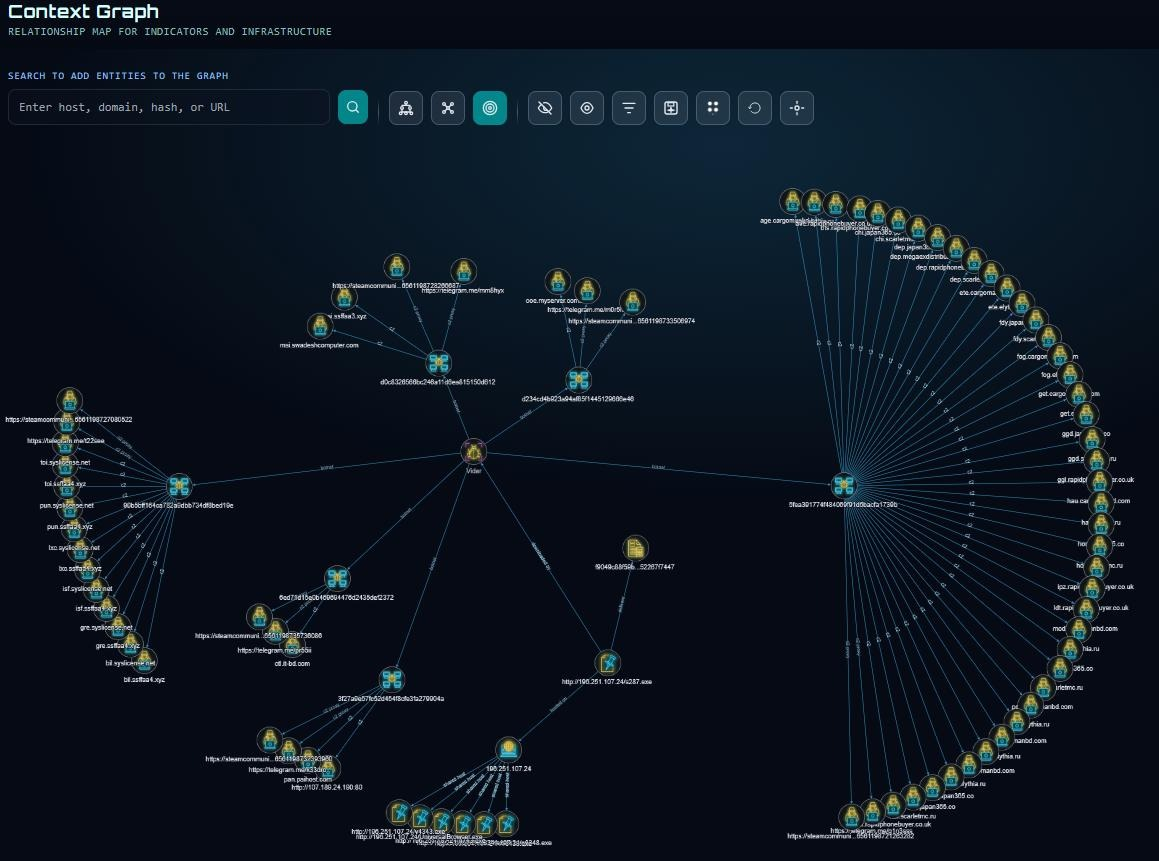
You can start from a blank graph and add a domain, IP address, URL or SHA256 hash. The graph automatically adds the first layer of nodes that is found in relation to the entity. Any of the nodes can be double-clicked to further pivot to additional nodes, creating edges between them.
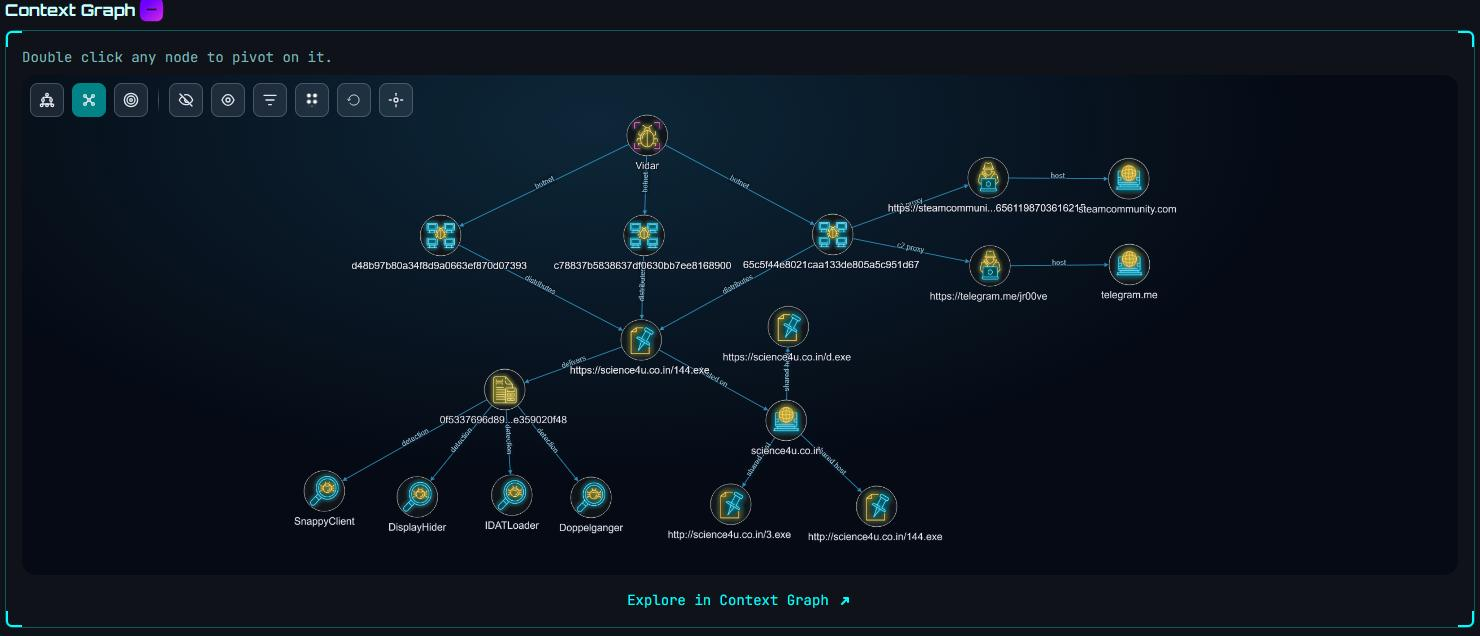
Visualize From a Task or Payload View
The task and payload views have a smaller version of the Context Graph that visualizes all the information from the task or payload view, creating an interactive and clear overview. This can be used to seed the stand-alone Context Graph and continue the analysis using the entire graph workspace.
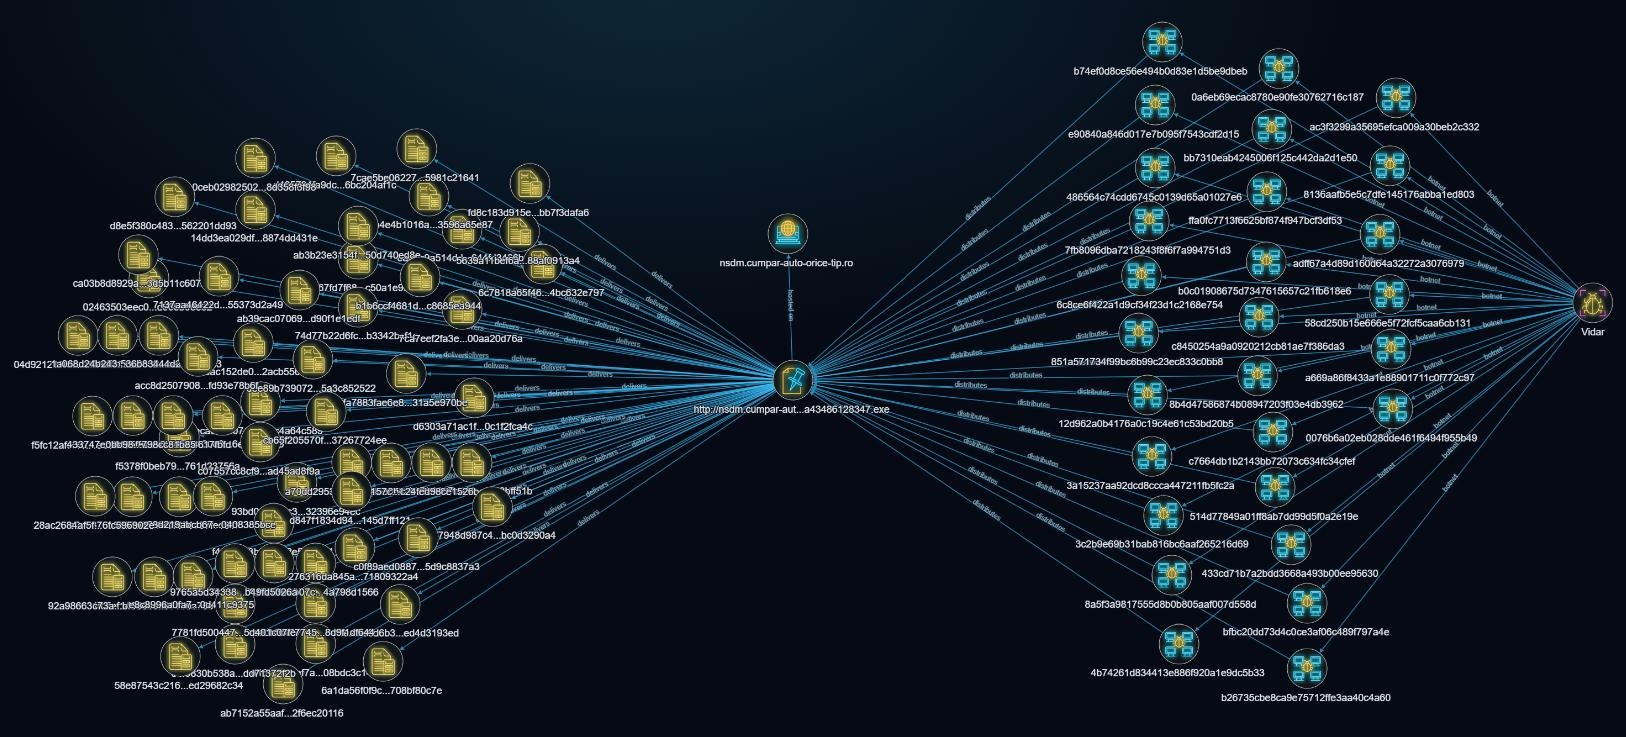
Correlate on Botnet IDs
Building on an earlier post where collected intelligence was used to track a threat actor across Vidar botnets, the Context graph can easily visualizes the correlation. Starting from the task http://nsdm.cumpar-auto-orice-tip[.]ro/ldms/a43486128347.exe from the post, the graph quickly shows an overview of the botnets involved and the magnitude of payloads resulting from the URL, with only a few mouse clicks.
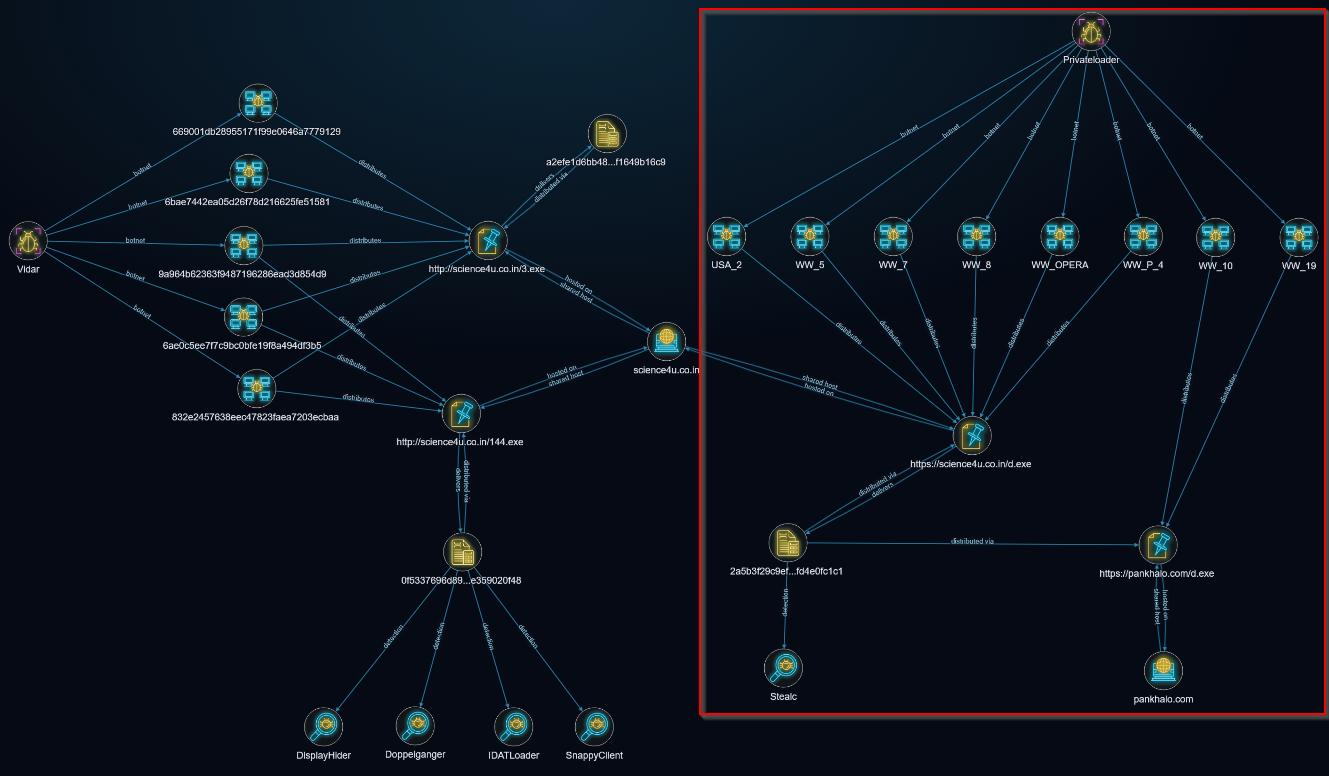
Trace a Domain to Reusage
Another Vidar example using the task http://science4u.co[.]in/3.exe visualizes the connections across botnets, tasks, domains and malware families. After a few pivots the graph shows that the domain science4u.co[.]in used to distribute payloads May-June 2026 was previously used in distribution payloads through multiple PrivateLoader botnets in September, 2024. And in addition showing a second domain pankhalo[.]com used to host the same payload (2a5b3f29c9ef00f3c760dbe59726938c4736f0360d0fe3458cbdacfd4e0fc1c1).
The Context Graph is available to all registered LIA users. If you run into anything unexpected, have thoughts on how the graph should behave or have specific use-cases, reach out to us.
Collection Through Emulation
Using emulators, LIA is able to collect first-hand intelligence and provide the relevant context required to get a full picture of an operator’s motivations and goals by embedding ourselves into deep into their botnets. The Context Graph enables our intelligence to be visualized and speed up investigations, and make more sense of the data.
Interested in a demo our of platform? Please reach out to us.